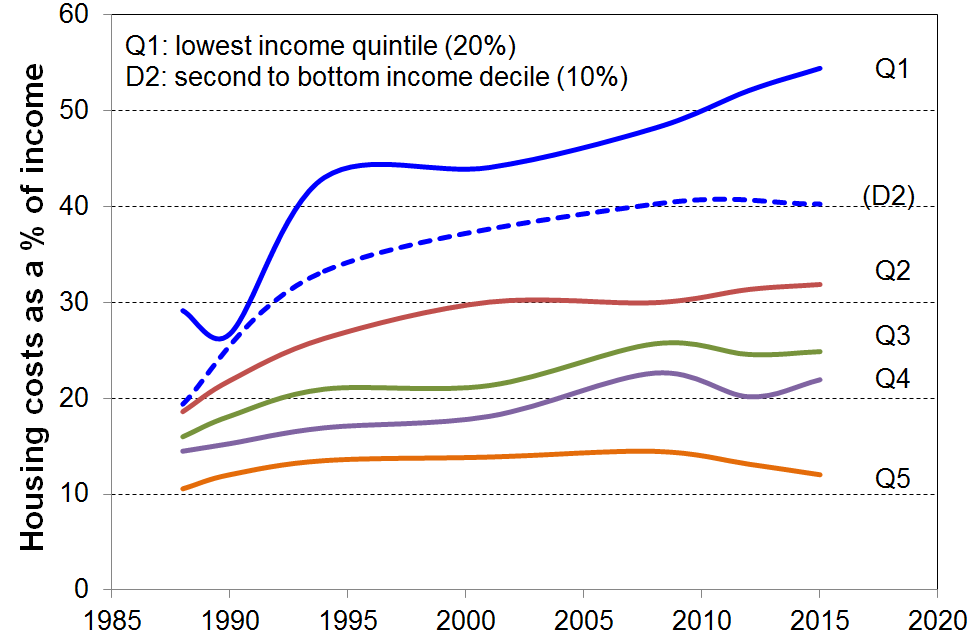
Housing costs now take a greater proportion of household income especially for low-income households:
- up from 14% in the late 1980s to 20% in 2015 overall for under 65s[1]
- up from 29% to 54% on average for the bottom quintile, and 19% to 32% for Q2.
Growing housing unaffordability is also shown through MSD administrative data
- In February 2016, 44% of AS recipients were receiving the maximum payment, up from 25% in February 2007.
- In June 2016, almost all renters receiving the AS spent more than 30% of their income on housing costs, three in four spent more than 40% and half spent more than 50% (see Table above).
- These figures were all up on what they were in June 2007 (90%, 67%, 40% respectively).
Housing quality
Major problems with dampness and mould, difficulty with keeping the house warm, and overcrowding are all issues with housing quality that have impacts on health and wellbeing, especially for children. The report shows:
- The issues are much more prevalent in lower-income households than in middle and higher income households, and are especially concentrated in households with low MWI scores (bottom quintile) – these are households experiencing multiple deprivation across a range of basics:
- a third of these bottom MWI quintile households report “a major problem”
- around 65-70% of those reporting “major problems” are in this lowest material wellbeing quintile, 75-80% for children (0-17 years).
- The issues are much more prevalent in rental accommodation than in owner-occupied dwellings:
- 70% of those reporting a major problem with either issue were in rental accommodation, 45% in private rental and 25% in HNZC homes
- in HNZC homes one in three are reported to be hard to heat or keep warm in winter.
Crowding
- For children (0-14 yrs) the rate in the 2013 Census was 16% (~130,000). It was 5% (~40,000) using the more severe measure, for which households need 2+ extra bedrooms. Crowding is in the main a children’s issue:
- 80% of those in crowded households are in households with children
- 38% of children in HNZC homes live in crowded accommodation (1+ needed).
- Those of Pacific ethnicity report the highest crowding rate in 2013 (39%) though this was down from 50% in 1986. The rate for Maori declined from 35% to 19% in the same period.
Go here to see more detail.
[1] Statistics New Zealand reports that housing costs took up 16% of household income on average in the 2015 HES. The difference in the numbers occurs because (i) Statistics New Zealand uses gross (before tax ) income whereas the Incomes Report uses after-tax income, and (ii) the Statistics New Zealand figure is for all ages, rather than the under 65s as above.